
About Us
Our Company
 Phenotype Screening Corporation was founded by Dan McDonald and
Ron Michaels in 2004 to commercialize soft tissue X-ray technology to image plant root
development non-destructively and at high resolution. They have since added automated
root system architecture characterization software to their product offering and have
expanded their services to include the imaging and characterization of other plant organs,
insect and nematode pests and the comparative analysis of chemical and biological plant
growth enhancers and stressors on root system development.
Phenotype Screening Corporation was founded by Dan McDonald and
Ron Michaels in 2004 to commercialize soft tissue X-ray technology to image plant root
development non-destructively and at high resolution. They have since added automated
root system architecture characterization software to their product offering and have
expanded their services to include the imaging and characterization of other plant organs,
insect and nematode pests and the comparative analysis of chemical and biological plant
growth enhancers and stressors on root system development.
Our Founders

Dan McDonald, President and Co-Founder. Dan spent his early engineering career developing scientific instrumentation at Oak Ridge National Laboratory. He took on progressively higher levels of management, culminating in being the Director, Instrumentation and Controls Division. As director he advocated for significant crossing training between biologists and engineers in anticipation of the approaching genomics revolution. He was a strong advocate for entrepreneurship and encourage the formation of several start-up companies based upon ORNL technology. After nearly 30 years Dan left ORNL and pursued his own entrepreneurial dreams.

Ron Michaels, Technical Director and Co-Founder. Ron has a PhD in Engineering Science with interests in Artificial Intelligence, Image Analysis, Pattern Recognition, Optimization, and Algorithmic Development. Ron brings a broad background in Development, Construction, and R&D to his work here. See Ron's CV.
Back to TopOur Customers
Our customer base is as diverse as the field of modern agriculture. We work with seed companies to improve their germplasm and stacked traits. We work with agrochemical companies to improve their formulations. We work with providers of biologics to improve their performance. We help agronomists better understand the effects of treatments and tillage on root system development. We work with environmentalists to improve phytoremediation. We work with foresters to improve stand densities and wind-throw resistance. In all cases we help develop improved root systems able to tolerate a wider array of biotic and abiotic stresses.
Our public collaborators include:
Cornell University
Duke University
Rutgers University
Tennessee State University
University of Tennessee
USDA Forest Service
USDA ARS
Washington State University
Much of our private sector work is done under non-disclosure agreements.
Back to TopOur Technology
Overview
Phenotype Screening Corporation championed the use of low energy X-ray technology to study plant development and plant interactions with their environment. X-ray imaging is an excellent approach for studying the complicated and three dimensional nature of root systems. This imaging method can also be used to image internal structure in seeds, fruits, ears, leaves, stalks and root pests. Please see our Products and Services pages for details of some of those applications.
Competing approaches to root system characterization suffer from severe limitations. Rhizotron based methods cannot characterize roots beyond the glass window boundary of their plates or tubes. Wash and scan methods based upon flat bed scanners require significant manual intervention to cut and scan planar subsets of the root system. Clear gel grown plants with optical scanning methods are limited to the young, uncomplicated root system of seedlings. Computed tomography methods are severely limited by throughput and volumetric constraints.
The steps in our plant root discovery pathway are outlined below.
Plant Growth
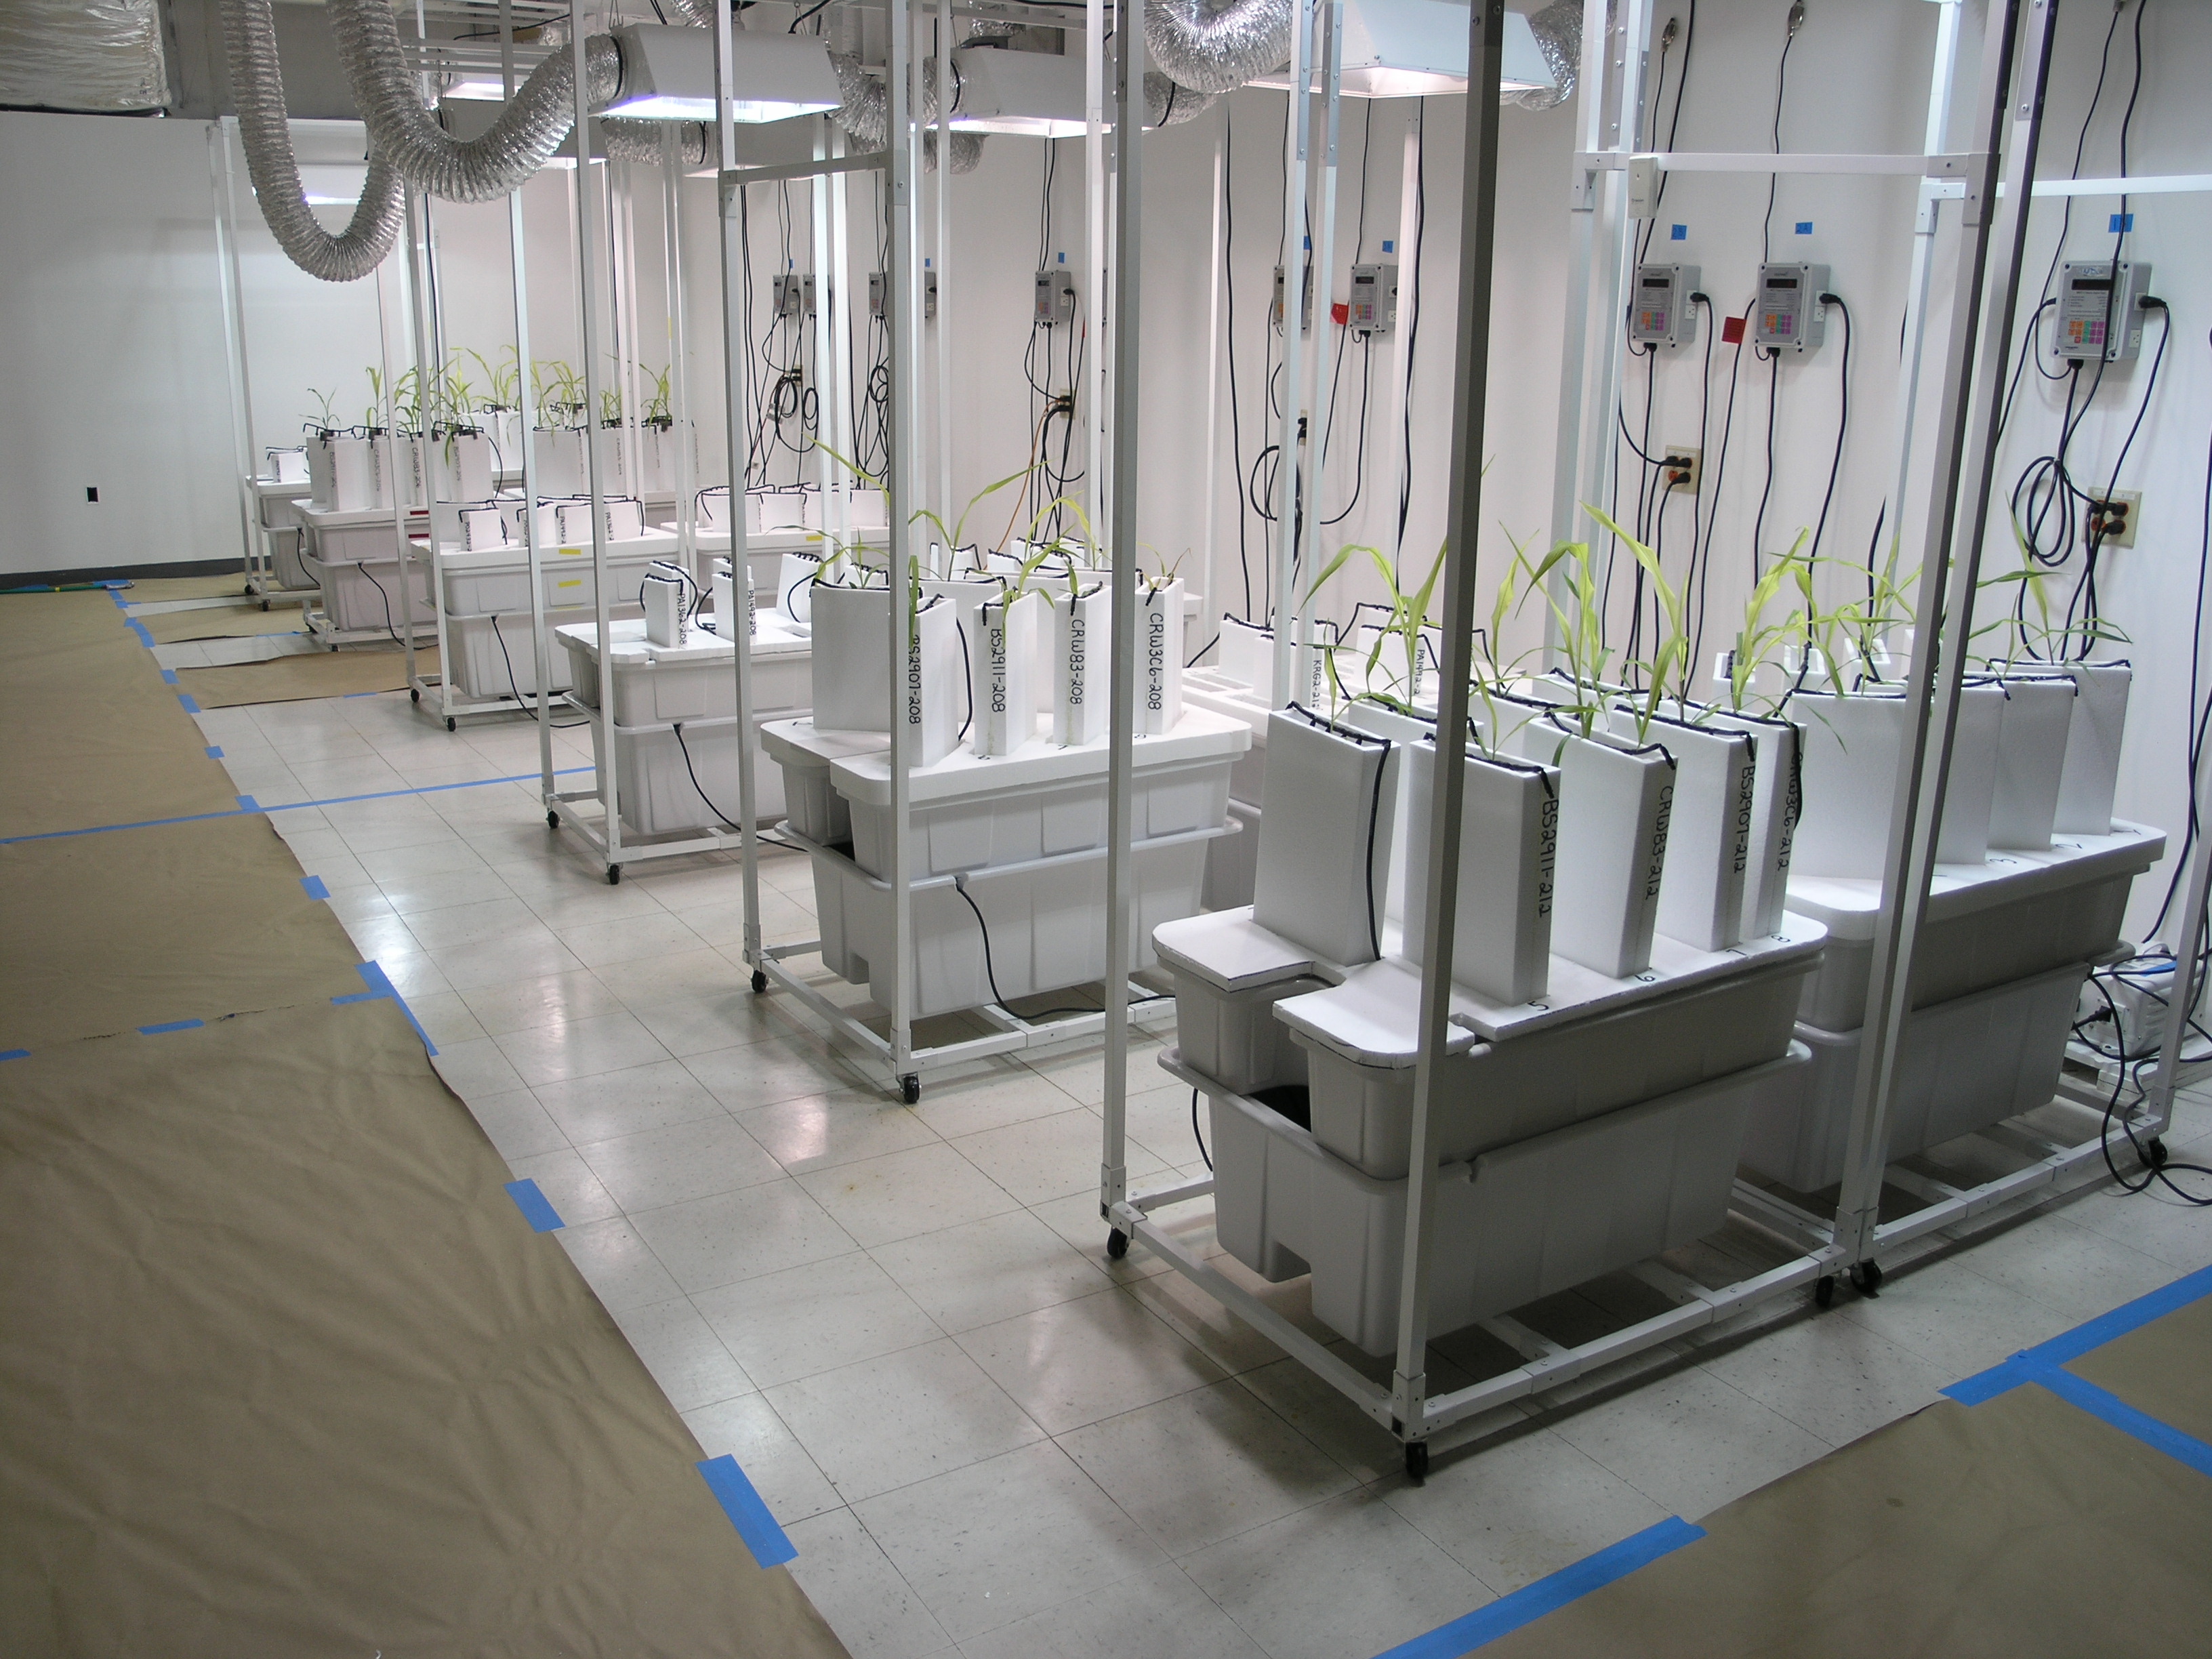
We grow plants in our Root Lab. Note the use of 1000 Watt metal halide bulbs and wall mounted timers. The timers also control nutrient delivery pumps located in the reservoirs beneath the plants.
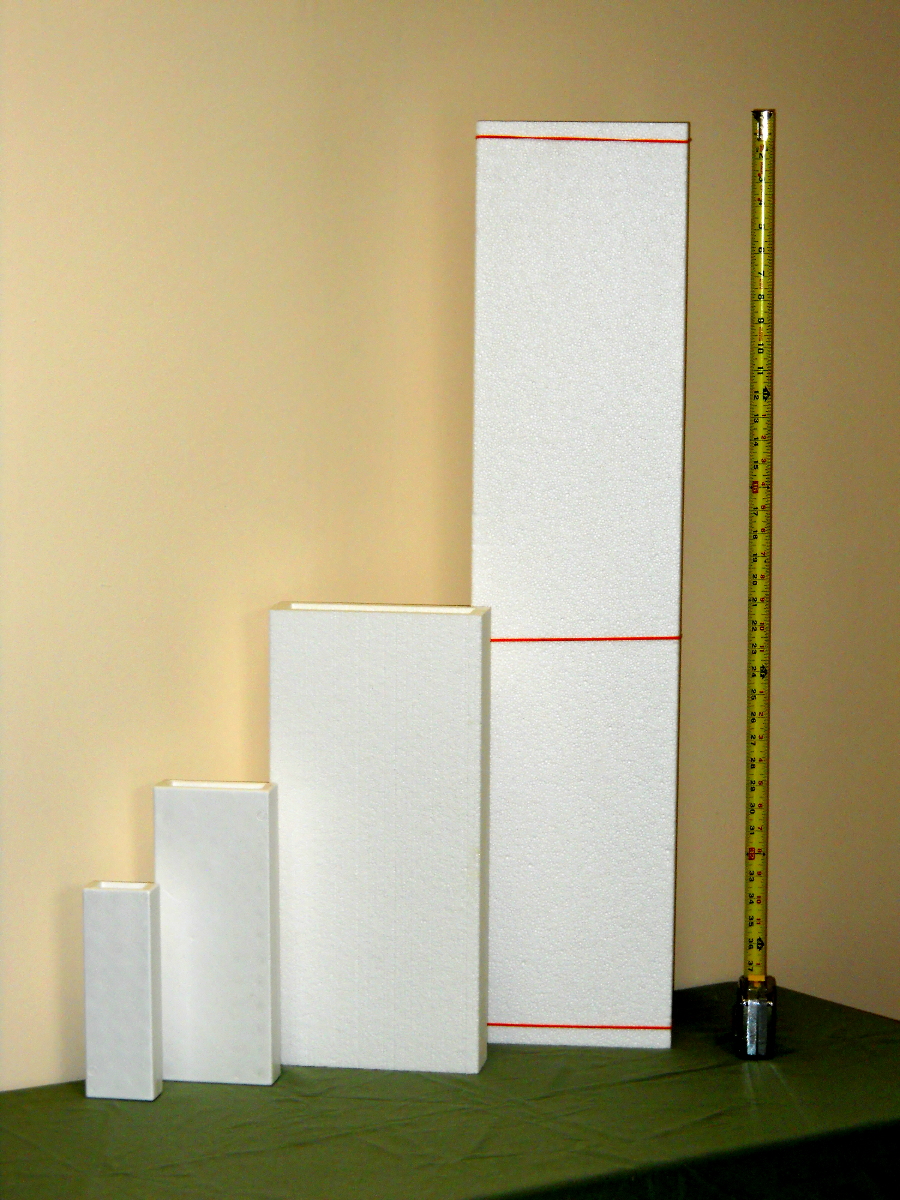
The containers and growth substrate are made from expanded polystyrene (EPS) because of the very low density and x-ray attenuation of this material. The containers are provided in sizes that range from 200 mm deep up to 1 meter deep to suit the size of the plant root system. The containers are shown below. (Ruler unit is inches.)
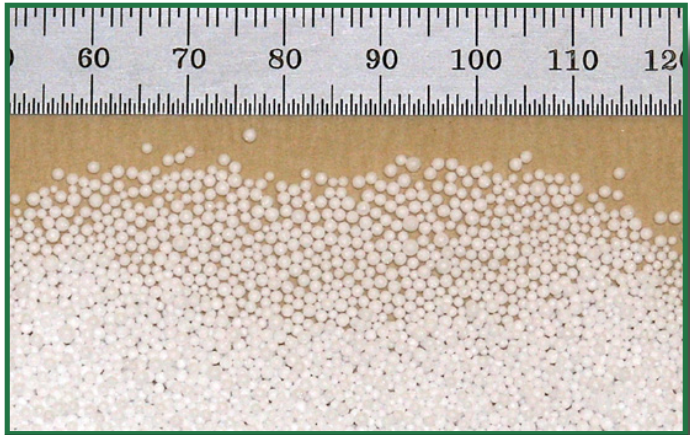
The substrate is a granular material made up of polystyrene beads. These beads are about 1 mm in diameter and have a very low bulk density of 1.5 pcf or 0.024 gm/cm3. The beads are closed cell and hydrophobic so they do not take on and hold moisture. Overall, our substrate acts like a coarse sand soil.
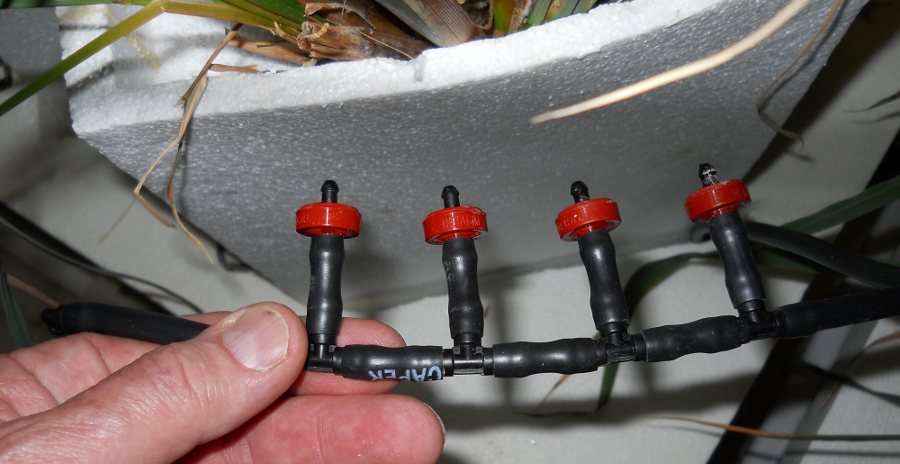
In order to provide moisture and nutrition to plants a drip irrigation system is used. Nutrient solution is recirculated using a pump-timer system that can be adjusted to provide a wide range of moisture and nutrient treatments. The nutrient solution is introduced and distributed using pressure compensated emitter tips.
X-Ray Imaging of Plant Roots
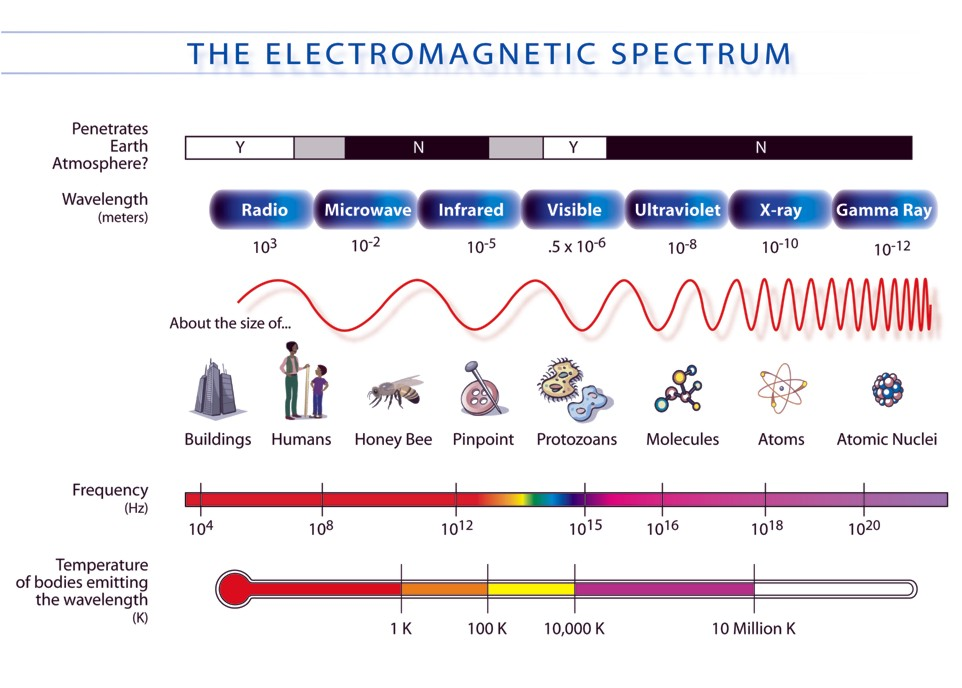
The low energy end of the X-ray spectrum provides us with a range of wavelength and attenuation properties that we exploit to give high contrast, and high resolution images of the soft tissue of plants. The chart below shows the X-ray spectrum in the larger context of all electromagnetic radiation.
We choose low density polystyrene for our plant growth substrate because of its low attenuation to x-rays at the 10keV level. Note in the below graph that pearlite of the same density has about ten times the attenuation of EPS.
Plant tissue is hydrogen and carbon based, both very low attenuation elements. The use of very low density, low attenuation of artificial growth substrate allows us to “see through” even fairly large roots. Silicon and calcium attenuate X-rays to a much greater degree. Most soils are made up of dense, high attenuation materials. Soil particles appear very dark in X-ray images. Even a thin layer of a mineral soil on a plant root can greatly attenuate the low energy x-ray beam. This is why field and greenhouse harvested root systems must be washed prior to X-ray imaging.

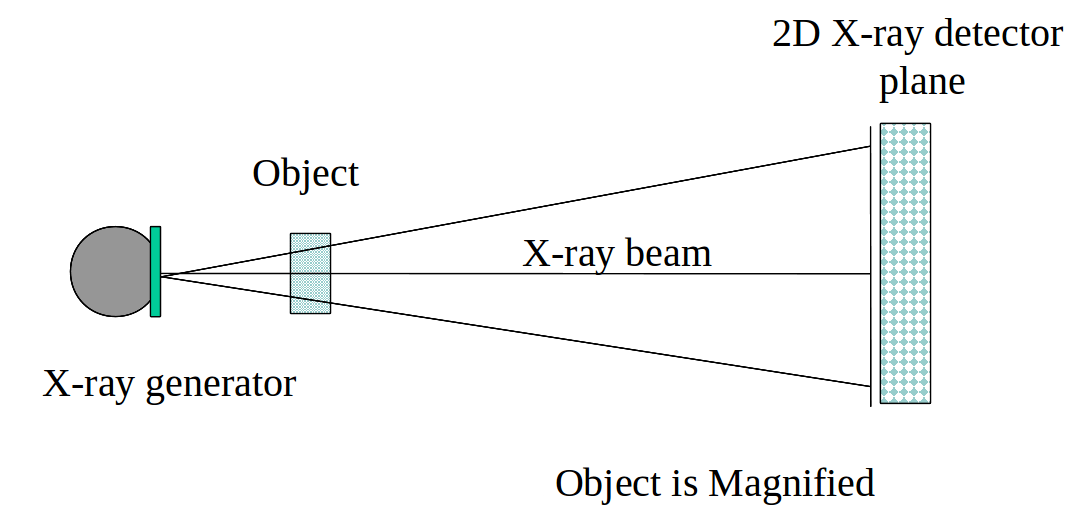
We use a transmission X-ray approach to generate our images. As shown below X-rays originating from a small spot with the X-ray generator are transmitted through our sample (object). These X-rays penetrate through the sample and are stopped and detected by our X-ray camera. The image from the camera has information about the entire volume penetrated by the X-ray beam.
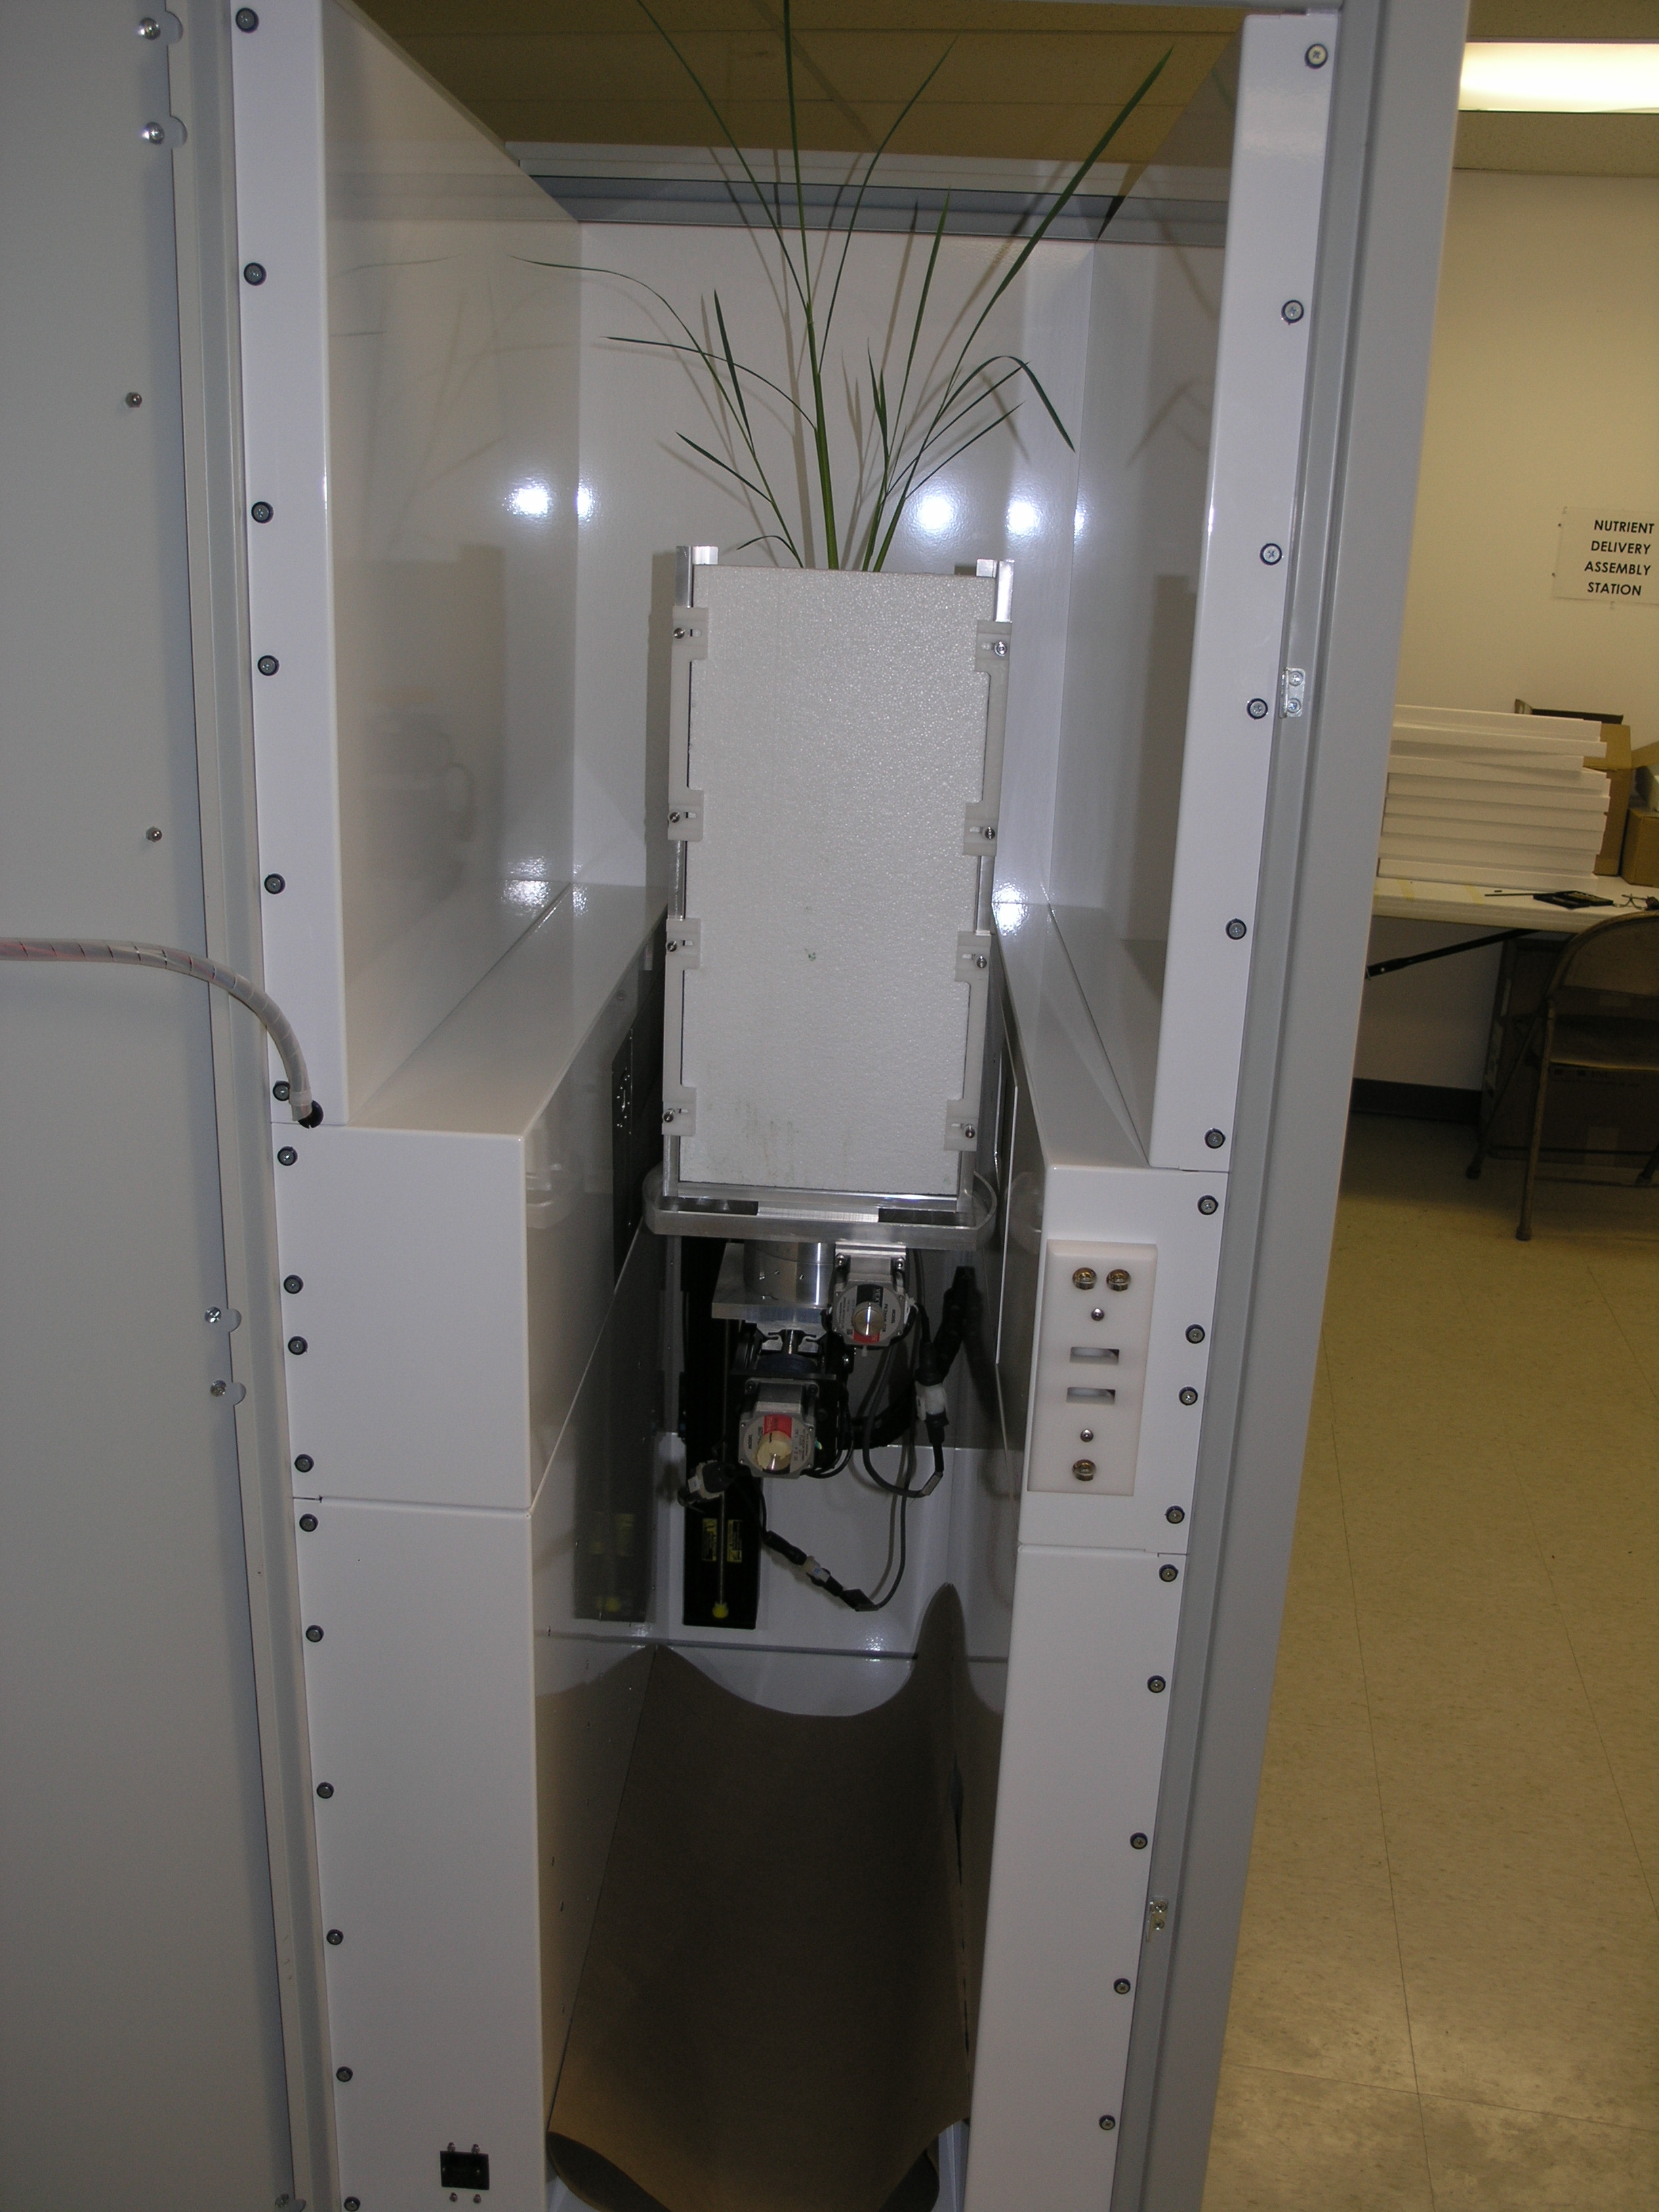
The below photograph shows a commercial unit with a rice plant positioned for imaging. When the image scan begins, the plant is rotated 90 degrees to align the large flat surface of the container with the plane of the x-ray camera. The vertical, horizontal, and rotary stages, visible under the plant container move the plant through a predetermined scan path in order to capture the entire area of the plant container. The x-ray generator and shutter are on the left side and the camera is on the right side of the cabinet.
Images
Raw images are captured by the x-ray system. These images are then enhanced and assembled into complete root system images. For human viewing, a stereo image can show spatial relationships that are not apparent from the individual 2D images. The below reduced resolution stereo image shows the result of this process.
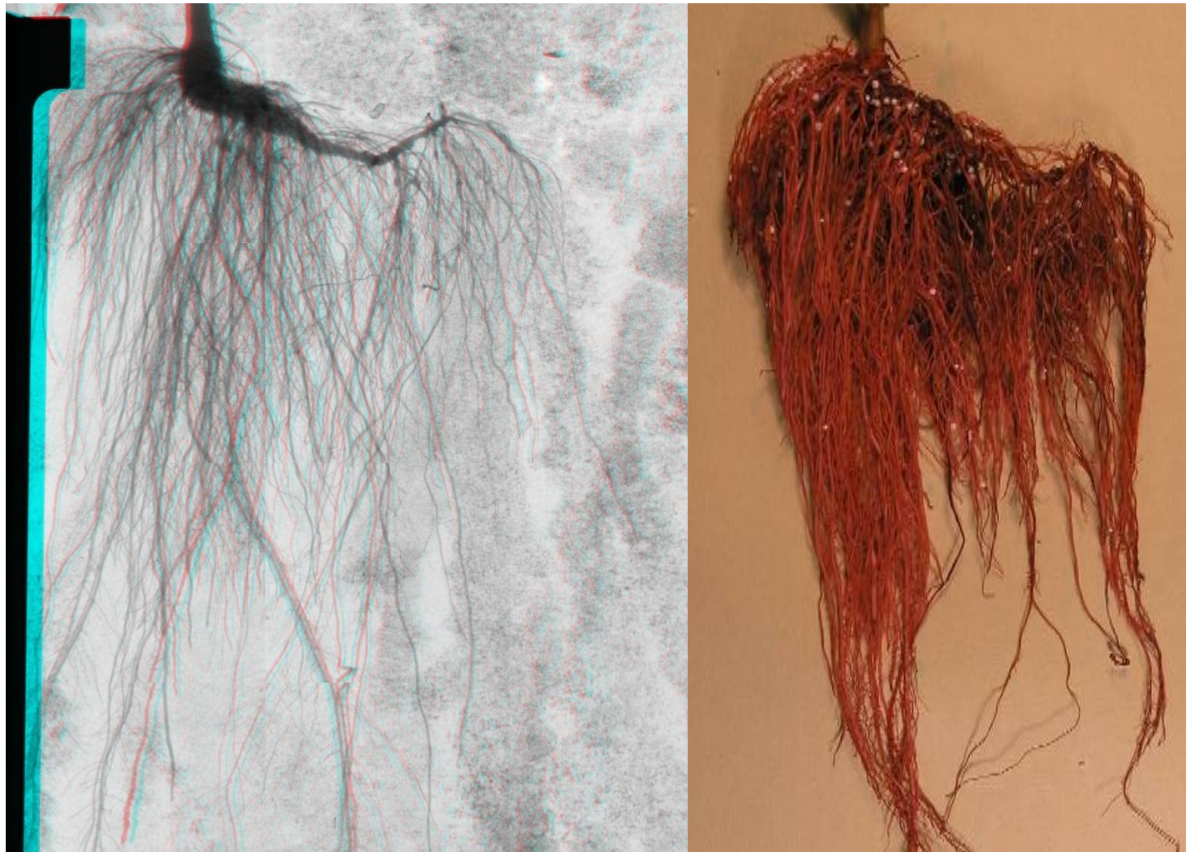
The Illusion of Fewer Roots: The figure below demonstrates the difference between “transmission imaging” used in our X-ray system and “reflective imaging” which is used in standard photography. The image on the left is an X-ray image of a pepper plant root system. A photograph of the same pepper plant root system (stained red in this photograph for nematode infection measurement) is shown on the right. Note that the top layers of roots in the photograph block the view of any roots behind them. The X-ray image however reveals every root in the volume; even roots behind other roots! This is a very powerful advantage of X-ray imaging when full root system characterization is the goal.
X-ray images look different than reflective light based images. The root system in the photograph on the right appears full and healthy (the red dye not withstanding.) The corresponding X-ray image gives the appearance of a root system that is sparse and scrawny; even though the photograph and the X-ray image are of the same root system taken on the same day! With viewing X-ray images and the superior information they convey one can appreciate their power in scientific imaging.
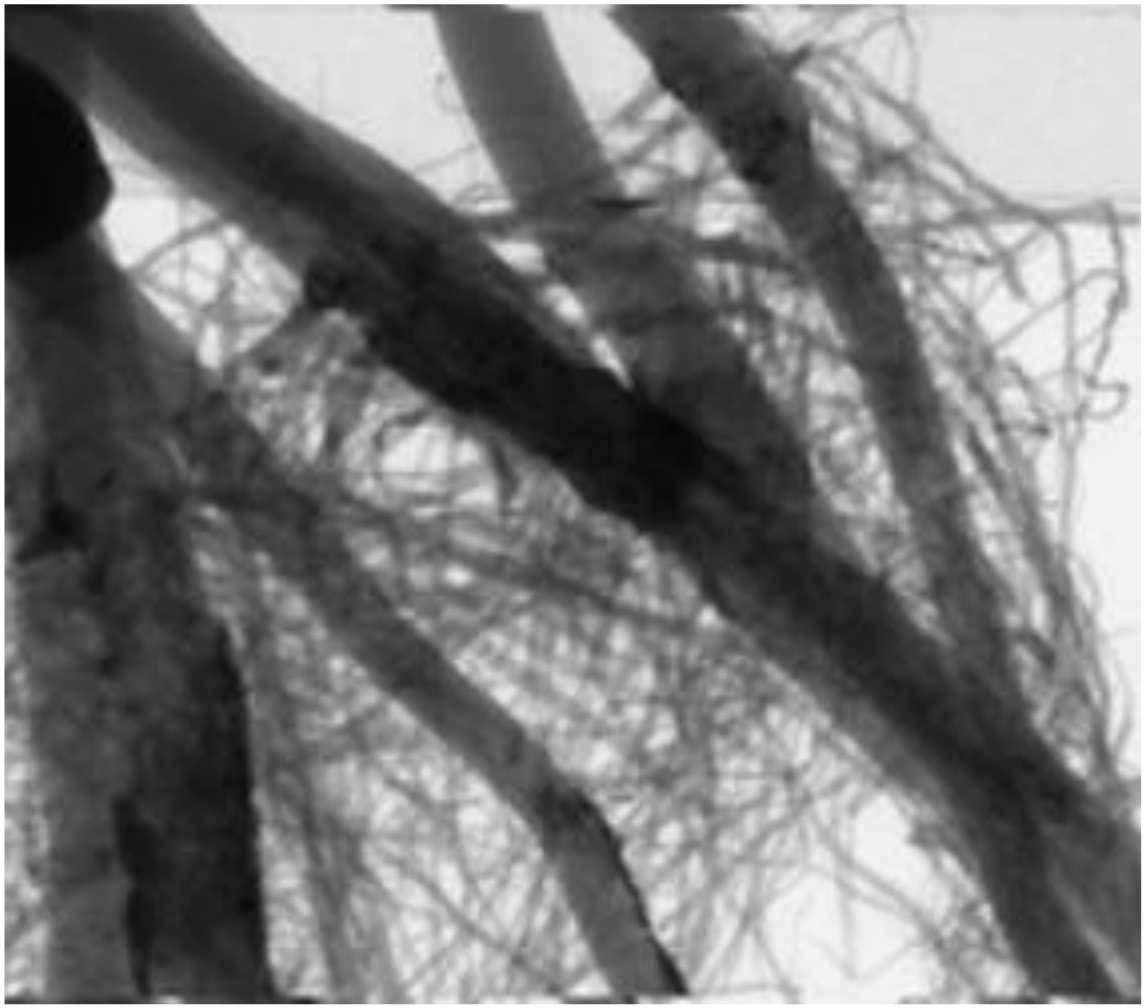
The diameter of plant roots can vary over a wide range. X-rays are attenuated as they pass through materials. The X-ray intensity drops exponentially as the thickness increases linearly. Very small diameter roots will appear faint while large diameter roots will appear darker. The below figure shows how small roots are visible behind larger roots in transmission type x-ray images.
Washed Root Imaging: Root systems that have been harvested from the field or greenhouse and carefully washed can be imaged and characterized with good precision. Mature root systems can be hard to characterize visually due to their complexity. Flatbed scanner approaches become cumbersome for the same reason. An X-ray approach is superior under these conditions as the third dimension content is easy handled in an X-ray image.
Washed root imaging gives excellent insight into root system development under realistic field and greenhouse conditions (intimate contact with the soil and its biota.) When proper handling and washing techniques are used very fine roots, root galls from root knot nematodes, egg masses from reniform nematodes, and soybean cyst nematode females can be preserved and visualized in the X-ray images. Disadvantages of washed root imaging include the difficulty of extracting intact root systems from some soils (particularly very fine roots) and the difficulty of interpreting the results from the standpoint of plant history during the growing season.
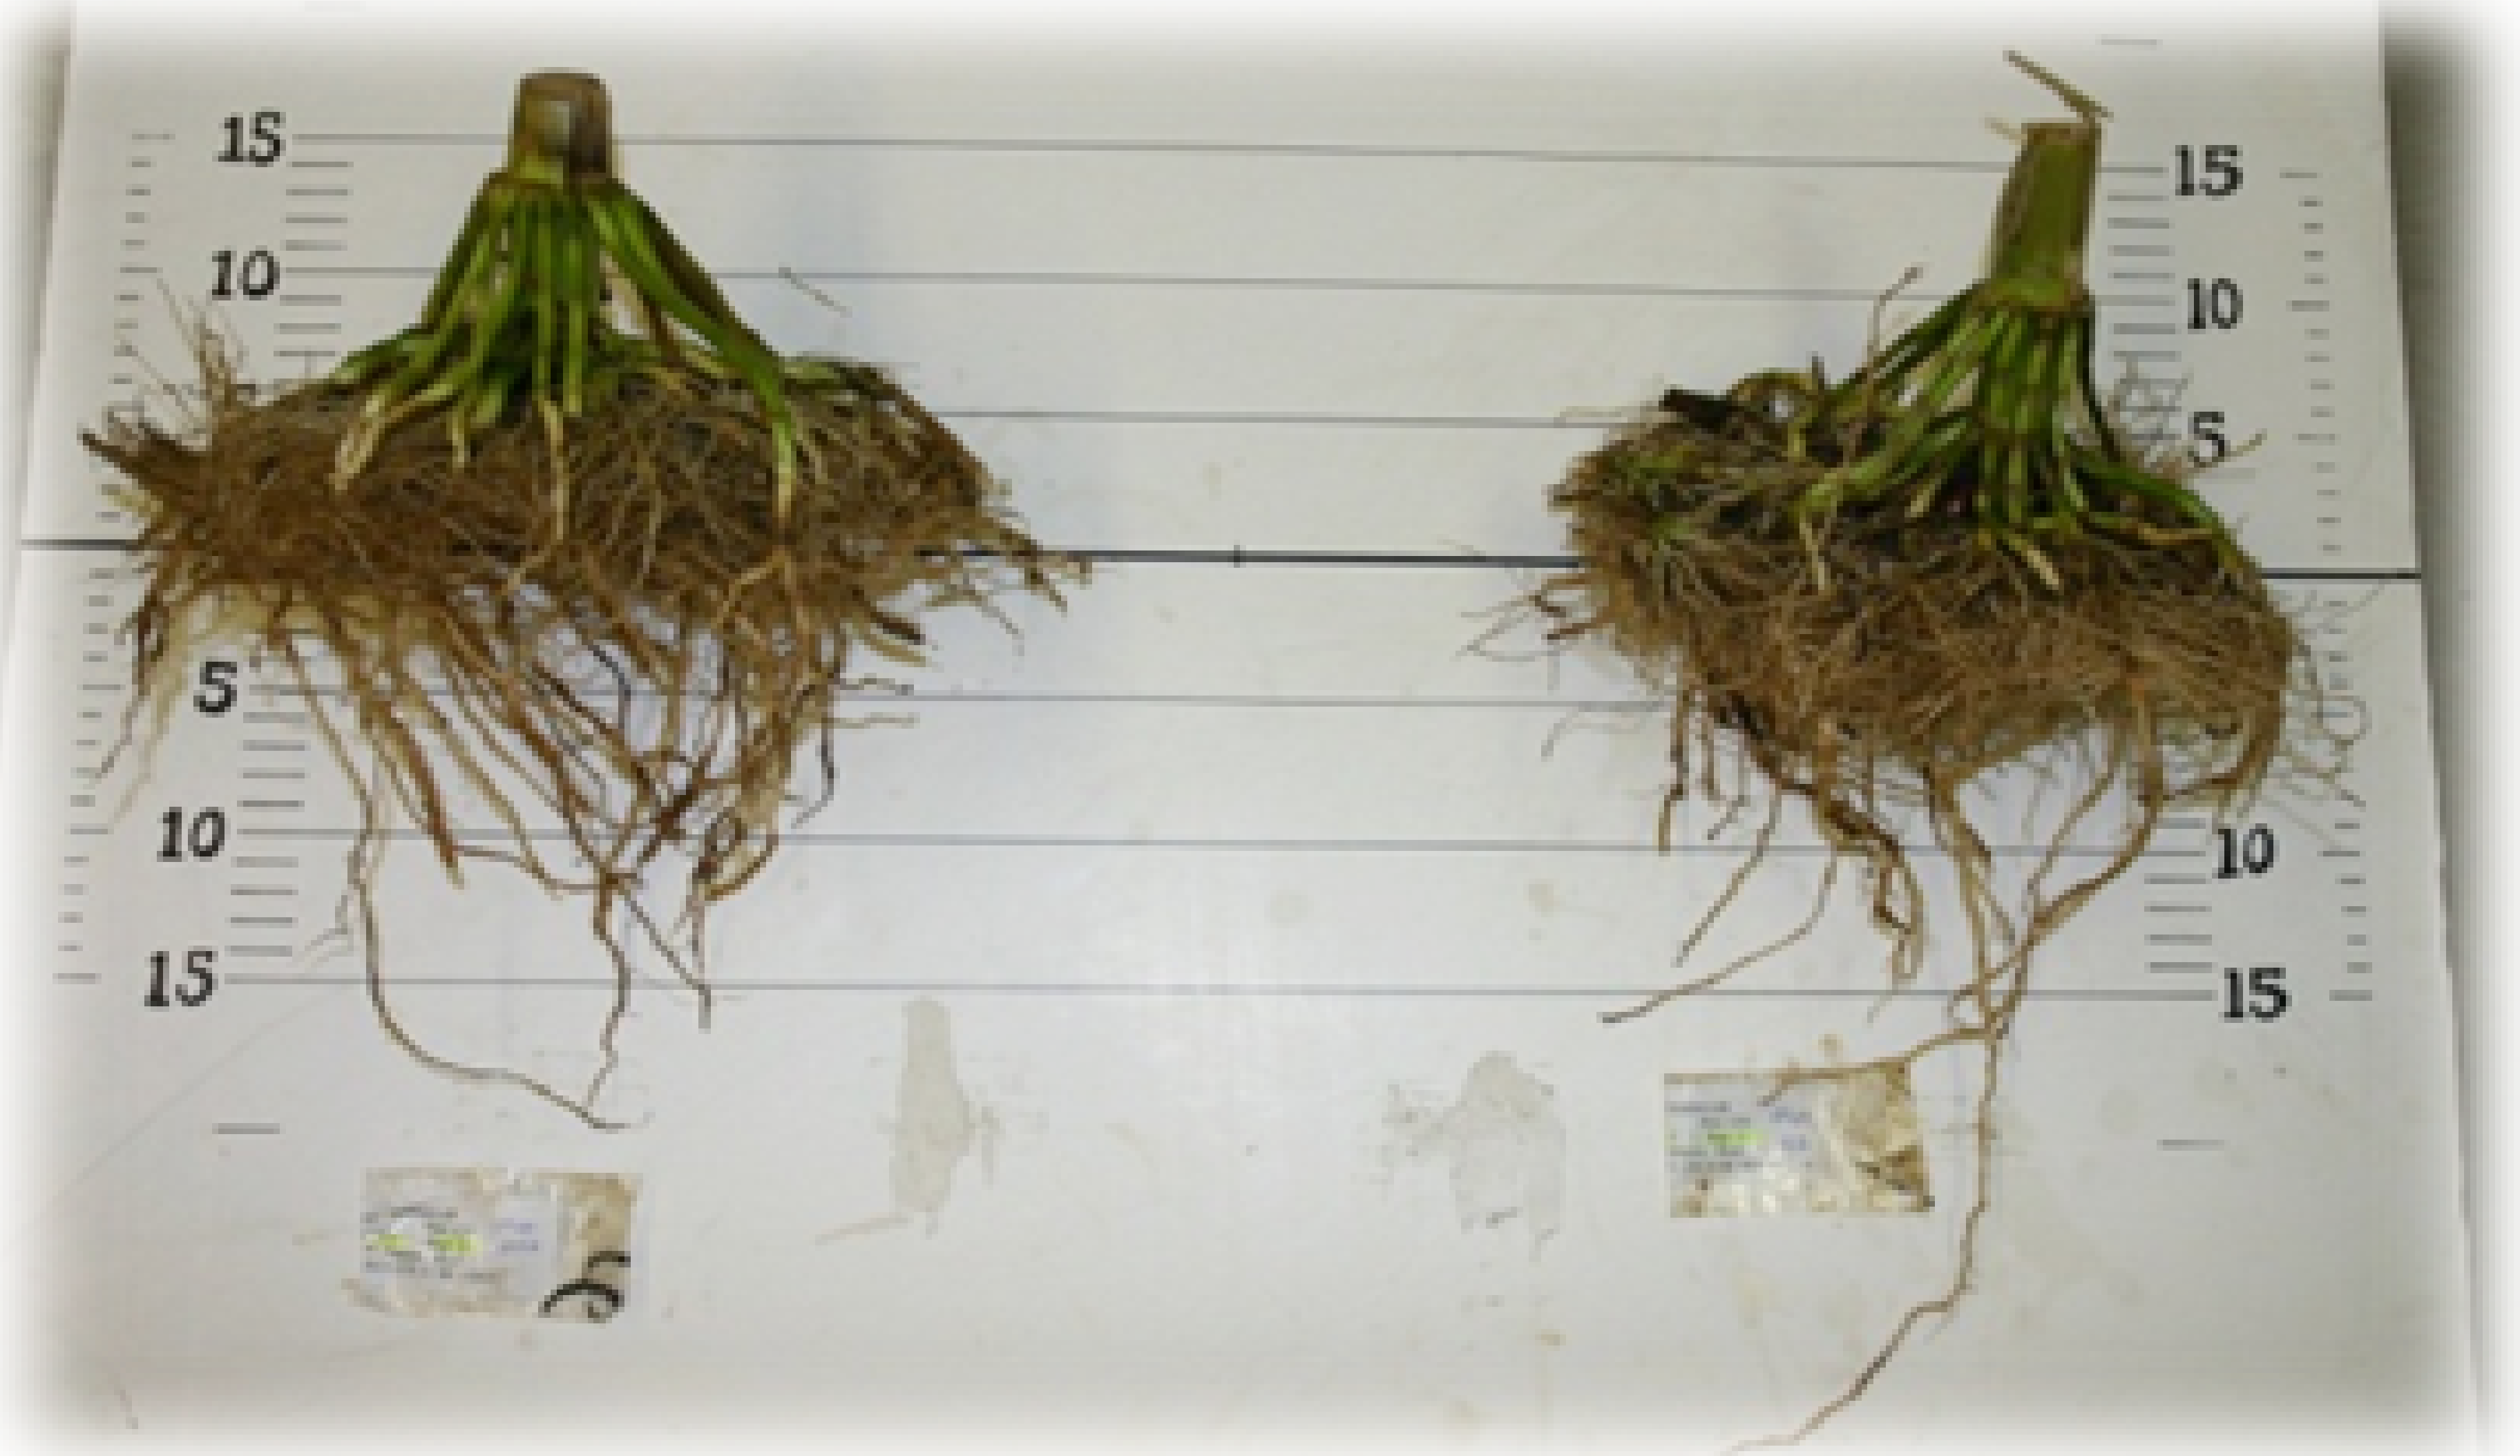
Image Analysis
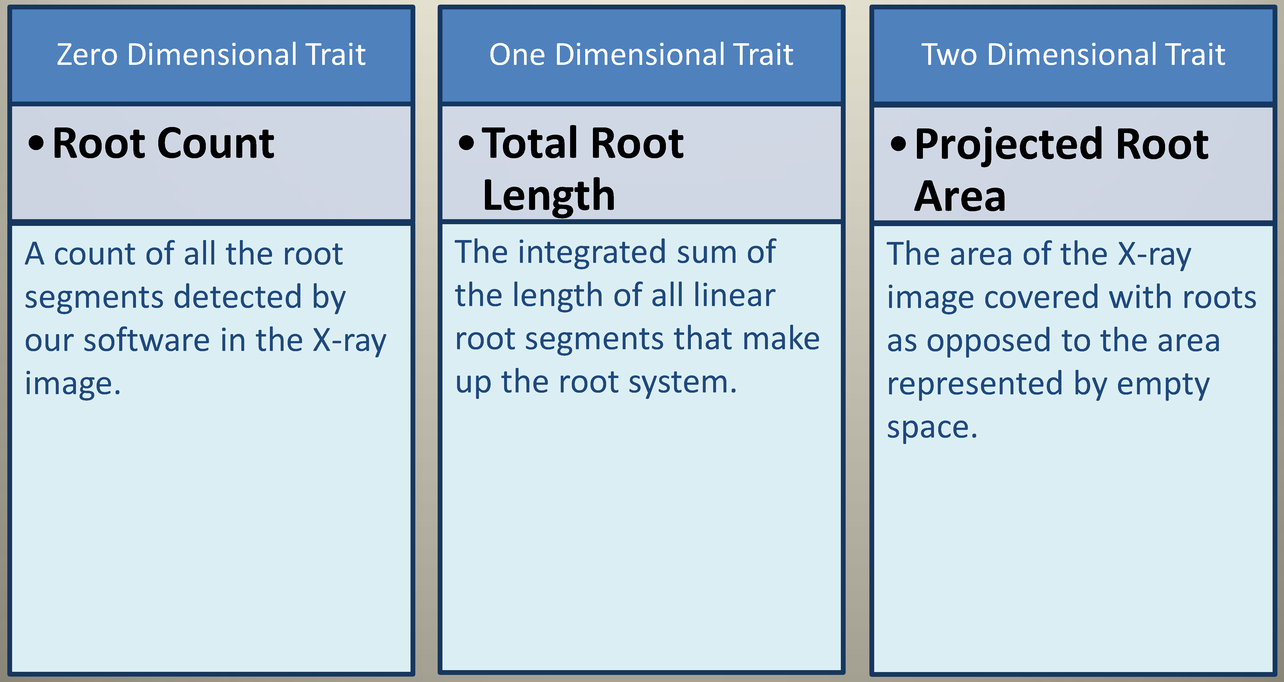
Phenotype Screening Corporation has developed a completely automatic root analysis software package. This software automates the entire process of processing images. In addition to image assembly as discussed above, our RhizoTraits software automates the process of segmenting out the roots and separating them out into size classes. Once segmentation is done, the software will quantify the total root length, projected area, and root count for each size class of roots at the whole plant level and as a function of root depth.
Various parameters of image analysis may be set interactively. The figure below shows the Image Segmentation parameters set screen.

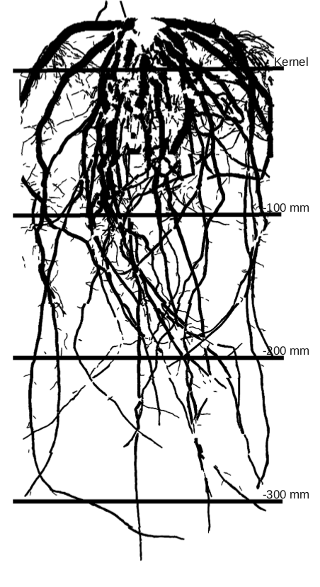
A segmented maize root system image that has combined all size classes into one composite image with transect crossings shown every 100 mm is shown below.
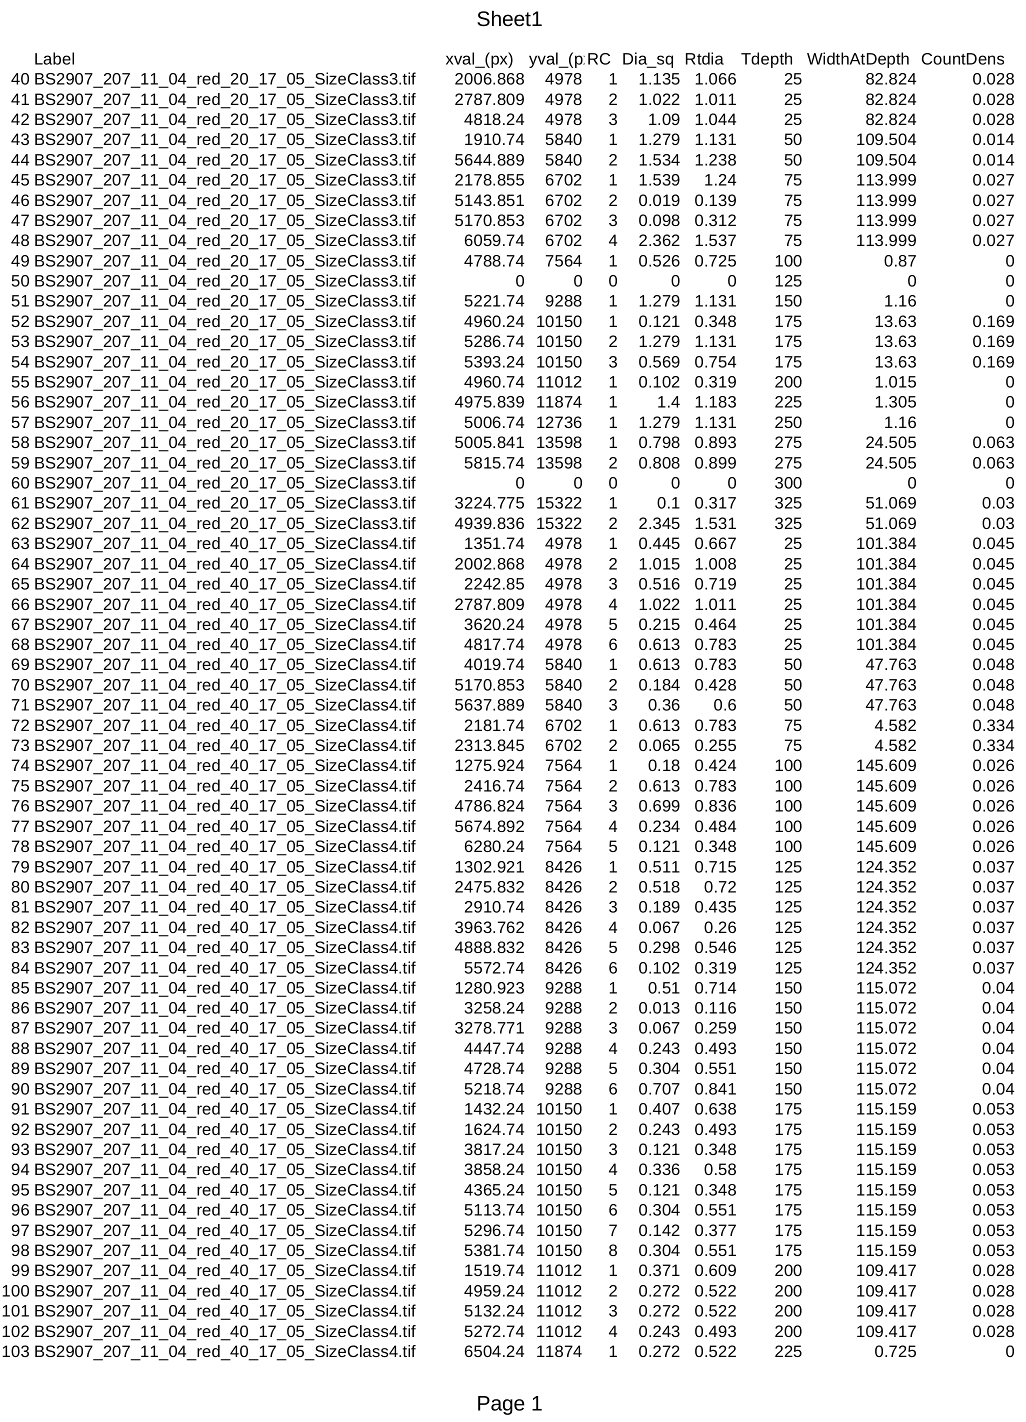
A small portion of a resultant analysis spreadsheet is shown in the below image. A typical spreadsheet for a small project would have several thousand rows.
Architectural Signature
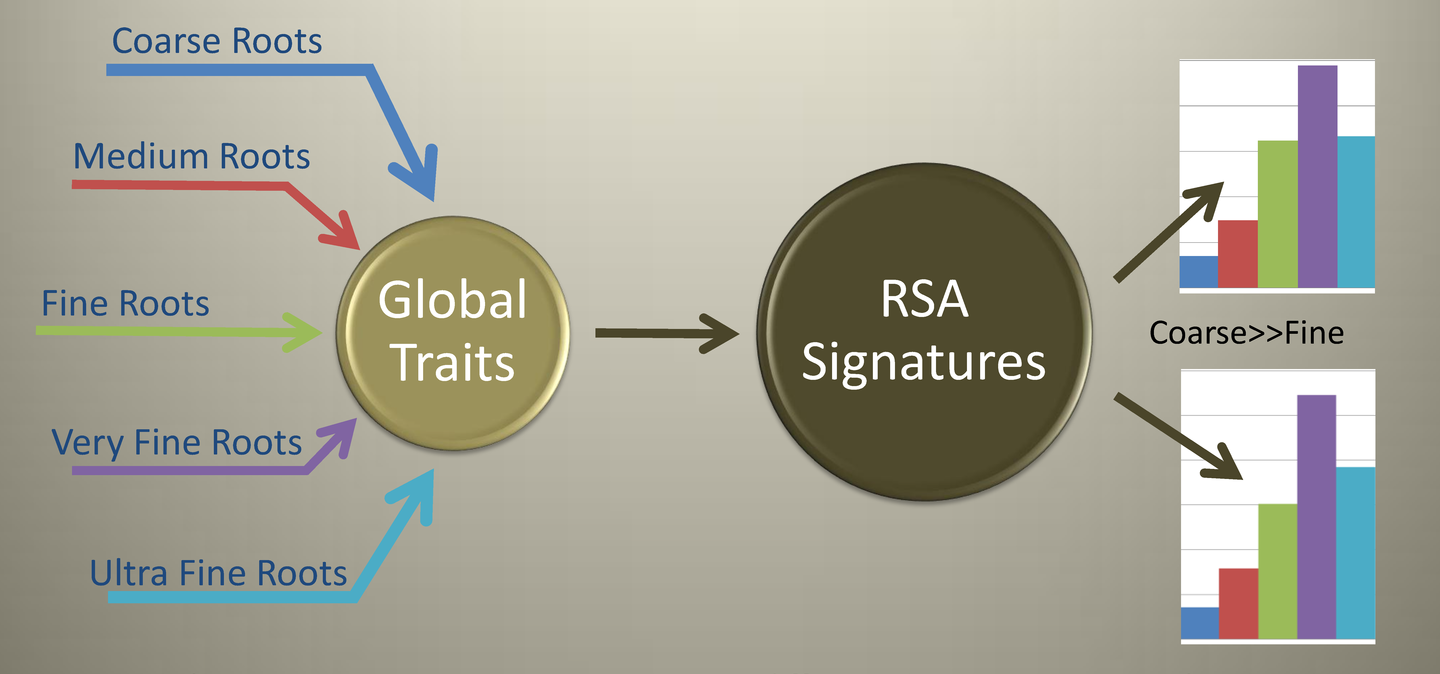
Our Focus is on Root System Architecture (RSA) Characterization. Emphasis is on the RSA and not on the details of individual root segments or root constituents. We generate a set of data signatures that together give insight into the RSA.
The size classes of roots used in our standard analysis are shown in the below illustration.
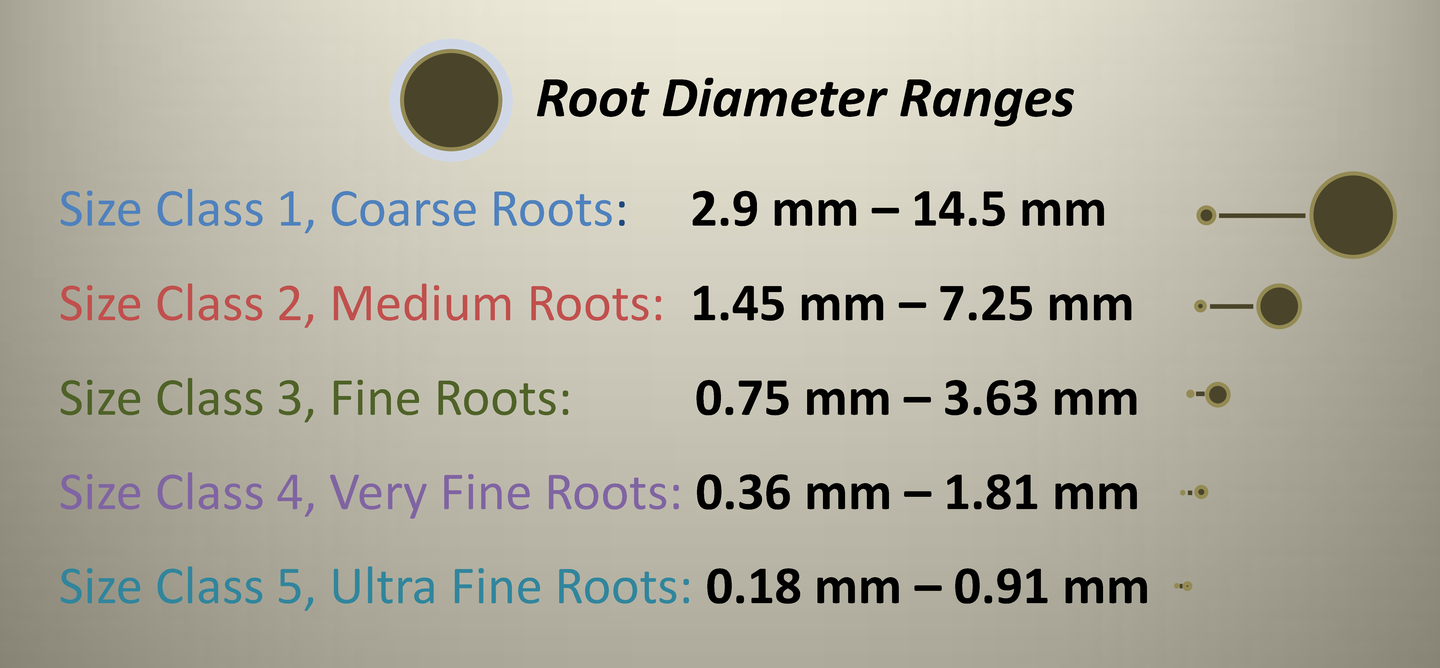
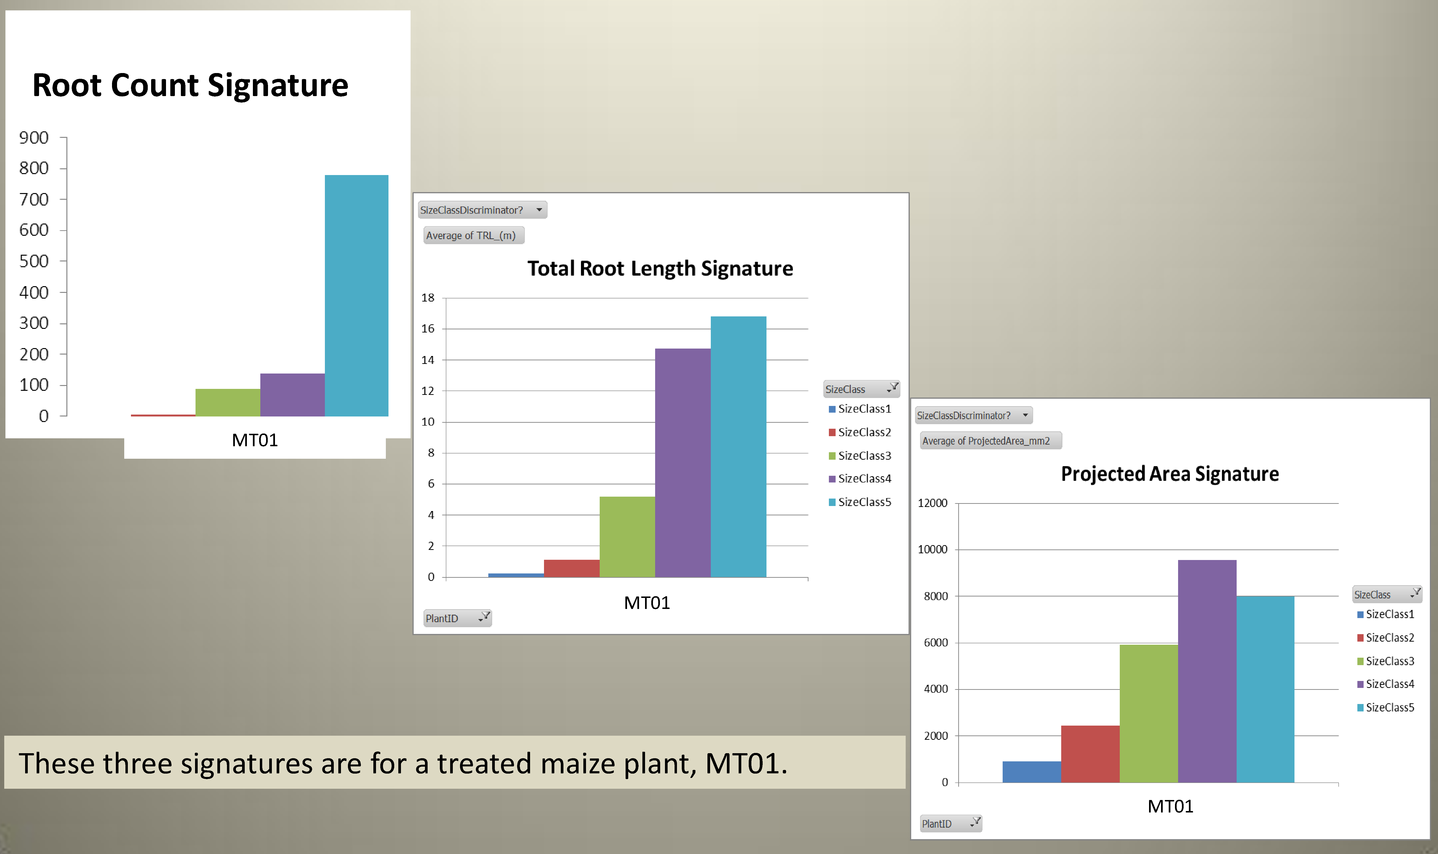
For each global root trait, total root length, projected area, and root count, a signature is produced that shows the distribution of each measured property by root size class.
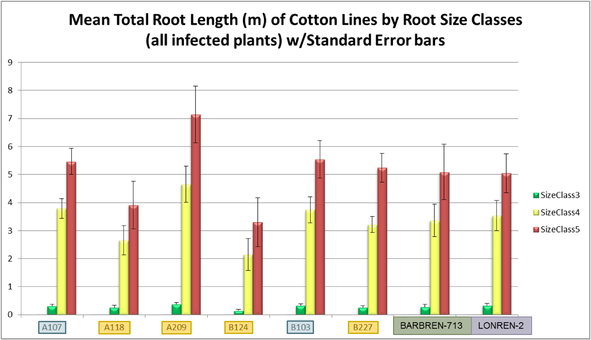
Root System Architecture signatures provide a meaningful way to compare the properties of root systems of different varieties. The below set of signatures shows how different lines of Cotton can be compared at a glance. The signature shown is Mean Total Root Length for all reps of each line. In this example the roots of Cotton plants grown in soil, washed, and imaged are compared.
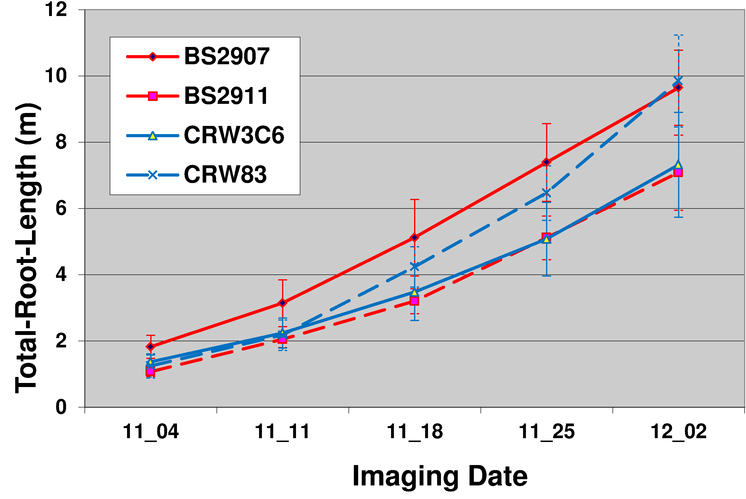
Temporal Signature
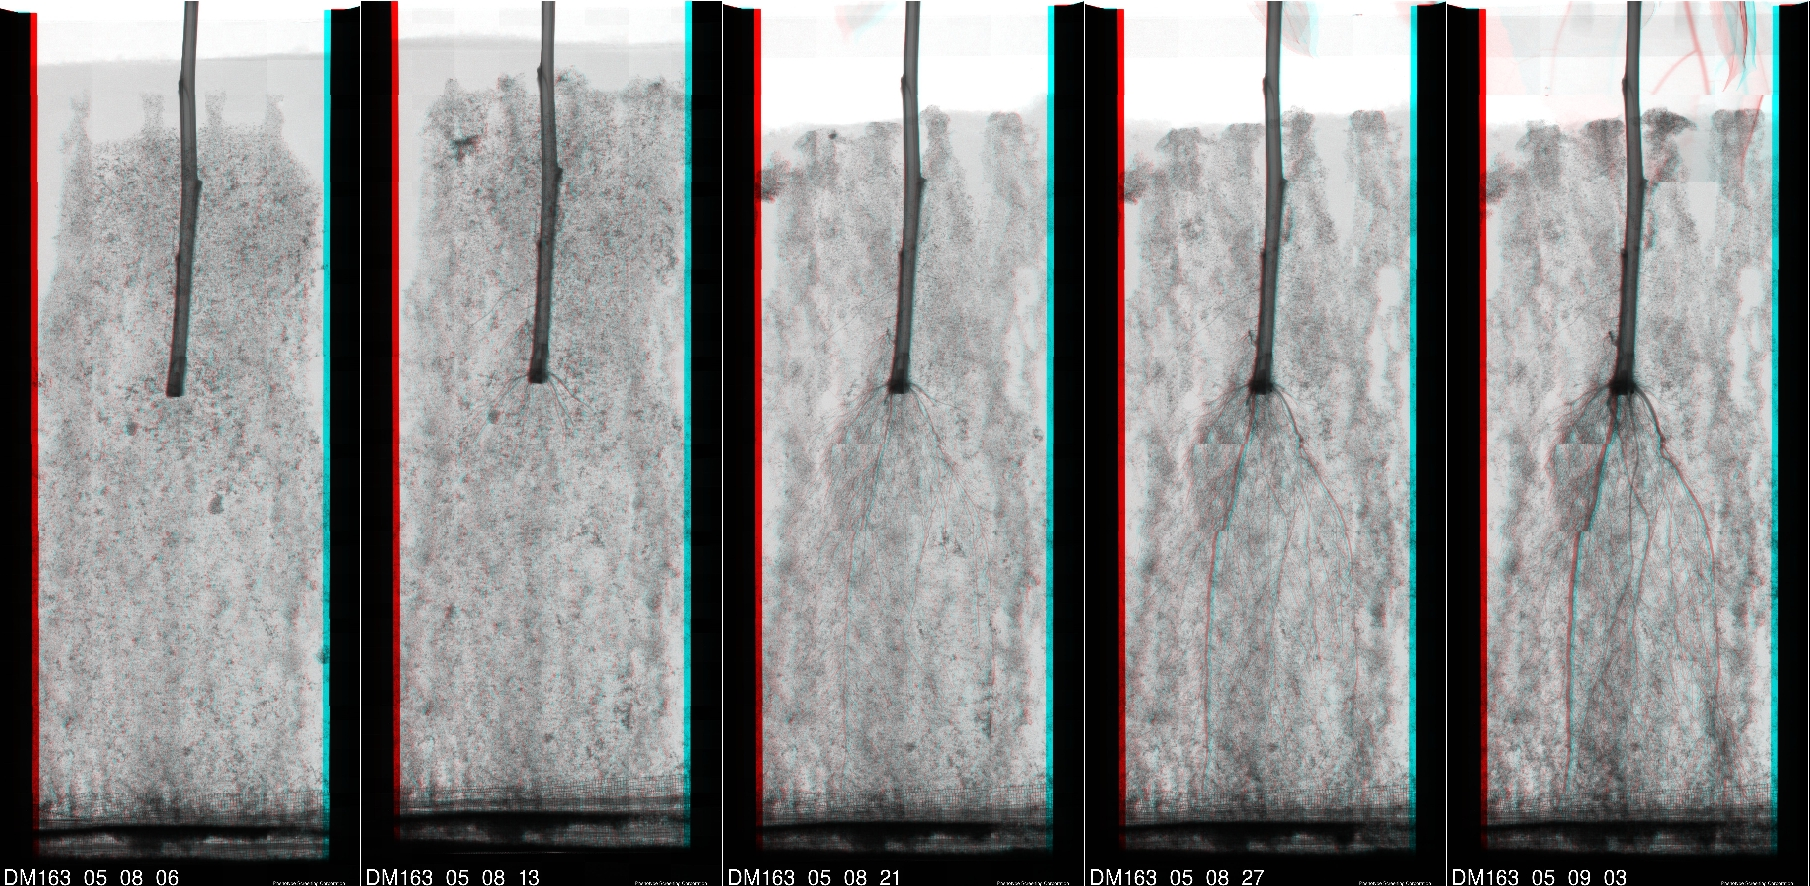
One of the advantages of the nondestructive imaging technology used by Phenotype Screening Corporation is the ability to take images of the same plant over time.
The below graph shows mean total root length of four Maize varieties vs. time. The plants were imaged weekly and the root system analysed. It is possible to see that variety CRW83 has a root development curve that has a higher slope than other varieties. This suggests that any plant assessment program should consider the entire development over time of the root system.
 Back to Top